
Login


07/07/2026
Category
General
For decades, regulatory and sustainability reporting worked the same way: fill in a template, submit a number, move on. Granular data reporting changes that model entirely. Instead of submitting pre-aggregated figures — often based on estimates — organisations report at the transaction, instrument, or asset level. The raw records go in. The regulator, the auditor, or the AI model assembles the picture from there.
This is not a reporting upgrade. It is a structural shift in how data flows between organisations and the institutions that oversee them.
Granular data reporting means submitting detailed, record-level data — individual transactions, instruments, assets, or operational readings — rather than summarised totals or estimated averages.
Think of it this way. Traditional reporting is like handing someone a summary of your bank statement: total deposits, total withdrawals, closing balance. Granular data reporting is handing over every transaction line, with dates, counterparties, and amounts intact. The recipient builds their own summaries, runs their own checks, and asks their own questions — because the underlying data is there to support it.
In practice, this means:
The principle is the same across sectors: move the data closer to the source, and let the analysis happen downstream.
Granular data reporting is not a new idea. Hong Kong’s Monetary Authority pioneered loan-level reporting back in 2019. Australia’s APRA modernised its data collection through APRA Connect. Singapore’s MAS launched an API-driven Data Collection Gateway that validates thousands of data points in real time.
But the shift is accelerating because three forces are converging at once.
Regulators are demanding it. In Europe, the Single Resolution Board (SRB) is already operationalising granular data through initiatives like the Minimum Bail-in Data Template (MBDT) and Expectations on Valuation Capabilities (EoVC). The European Central Bank’s Integrated Reporting Framework (IReF) — targeting full adoption by Q4 2029 — will formalise granular data reporting as the standard for statistical and prudential submissions. In Asia, MAS published its Transition Planning Guidelines on 5 March 2026, explicitly requiring banks to differentiate the granularity of climate data they collect based on risk materiality.
Standards bodies are codifying it. PCAF released its Third Edition Standard in December 2025, sharpening its data quality scoring system. The scale runs from 1 (verified, asset-level, third-party audited) to 5 (estimated from sector and regional averages). The message is plain: verified granular data sits at the top of the hierarchy. Spend-based estimation sits at the bottom.
AI needs it. Credit risk models, transition finance scoring tools, and ESG analytics engines are now being built directly on top of reported data. When the input is a regional average, the model inherits that imprecision in every output. Granular data reporting is not just a compliance exercise anymore — it is a data-quality discipline that determines whether AI-driven decisions are trustworthy.
This is where the confusion tends to sit. ESG reporting platforms are everywhere. Dashboards are polished. Reports are generated. But the data underneath? In most cases, it is still estimation.
Here is a practical comparison.
| Dimension | Traditional ESG / regulatory reporting | Granular data reporting |
|---|---|---|
| Data level | Aggregated totals, portfolio-level summaries | Transaction-level, asset-level, instrument-level records |
| Data source | Spend data, industry averages, proxy models | Meter readings, verified activity data, primary records |
| PCAF Data Quality Score | Typically DQS 4–5 (estimated) | Targets DQS 1–2 (verified, activity-based) |
| Reporting frequency | Annual or quarterly snapshots | Continuous or near-real-time |
| Flexibility | Fixed templates — redesigned with every rule change | Raw data submitted once, multiple views assembled downstream |
| Audit trail | Report-level verification | Record-level traceability |
| AI readiness | Estimates propagate uncertainty into models | Verified inputs support reliable model outputs |
The distinction matters because, from a buyer’s perspective, the interface can look identical. Two platforms can both produce a PCAF-aligned financed emissions report. But one calculates it from verified, asset-level activity data with a DQS of 1 or 2. The other fills gaps using machine-learning models trained on spend data and regional averages — scoring a DQS of 4 or 5. The report looks the same. The data quality underneath is fundamentally different.
As the GHG Protocol’s own Scope 3 Technical Guidance makes clear, spend-based methods are the approach to use “when other methods are not feasible” — the floor of the methodology hierarchy, not the standard to aim for.
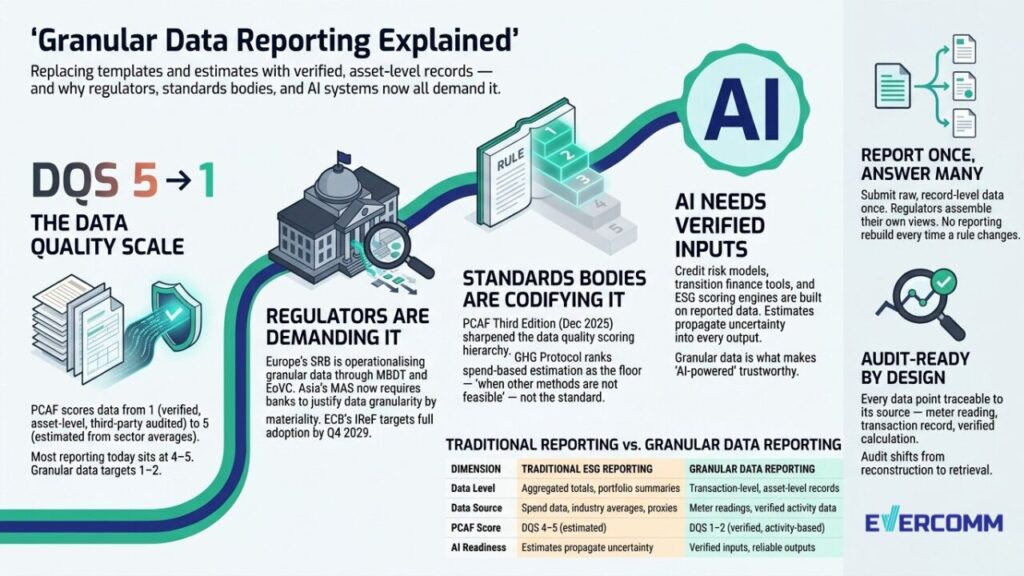
When organisations submit granular, record-level data, they do not need to redesign their reporting every time a regulation changes. The SRB’s approach in Europe illustrates this: banks map their data once into a structured, machine-readable format, and regulators assemble the views they need. As Erik Becker of Regnology puts it, the shift turns complex regulatory change into a data-sourcing exercise rather than a reporting-rebuild exercise.
PCAF’s data quality score makes the difference between verified and estimated data explicit — a score of 1 means a third-party auditor verified the calculation; a score of 5 means it was derived from a regional average. Granular data reporting forces that transparency. Regulators, auditors, and credit committees can see exactly where the numbers come from, line by line.
When AI models — credit risk engines, transition finance tools, ESG scoring systems — are trained on verified, asset-level data, their outputs are more reliable. When they are trained on estimates built from estimates, uncertainty compounds with every layer. Granular data reporting is the discipline that makes “AI-powered insights” actually mean something.
Every new template, every revised framework, every updated disclosure standard currently triggers a reporting-rebuild cycle. With granular data infrastructure in place, the raw data is already collected and structured. New requirements become a reconfiguration of views, not a redesign of pipelines.
When every data point is traceable back to its source — a meter reading, a transaction record, a verified calculation — audit preparation shifts from data reconstruction to data retrieval. Organisations spend less time assembling numbers and more time explaining them.
Evercomm has been building granular data infrastructure since 2013. The NX Engine — the AI-powered core of Evercomm’s Granular Data service — produces PCAF-aligned, asset-level Scope 3 Category 15 calculations with per-line data quality scoring. It is not estimating emissions from spend data. It is calculating them from verified, activity-based records and scoring every line.
This is already live. CTBC Bank — the PCAF Asia-Pacific Chair — runs its financed emissions on Evercomm’s NX Engine, replacing annual spend-based snapshots with real-time MRV (Measurement, Reporting, and Verification) and saving over 1,500 man-hours in the process. ISO 14064 verified. Bureau Veritas certified. Singapore-recognised.
Evercomm’s tagline — Powering AI with facts — is a literal description of what granular data reporting enables. When the data underneath is verified and asset-level, AI models built on top of it produce outputs that hold up in a credit committee, survive an audit, and meet the regulatory bar that MAS, PCAF, and the SRB are now setting.
The shift from estimation to granular data is not coming. It is here — in Europe through the SRB and IReF, in Asia through MAS and PCAF, and globally through every regulator that has decided templates and averages are no longer enough.
The question for any organisation is straightforward: is your data granular enough to support the decisions being made on top of it?
Granular by default. Verified by design. Sustainable by outcome.
References:


Evercomm is a multi-award winning engineering and technology company helping industries build resilience, unlock growth opportunities and navigate the evolving regulations landscape across carbon, energy, waste, and beyond.
Since 2013, we have been helping businesses optimise resource efficiency, reduce carbon emissions, manage climate risk scenarios, and meet international compliance standards ensuring long-term operational and financial sustainability.
Our advanced planning and simulation tools provide precision-driven carbon, energy and waste reduction strategies tailored to your unique operations. Grounded in internationally recognised ISO Standards, Evercomm ensures data integrity, credibility, and verifiability in emissions reduction tracking and reporting. By integrating globally recognised compliance frameworks, including GRI, SBTi, ISSB, and ESRS, we enable organisations to meet stringent regulatory requirements while reinforcing their business resilience.
As a trusted partner, Evercomm helps businesses turn compliance obligations into strategic advantages ensuring they stay ahead in a rapidly shifting economic and regulatory environment.