What is a product carbon footprint, really?
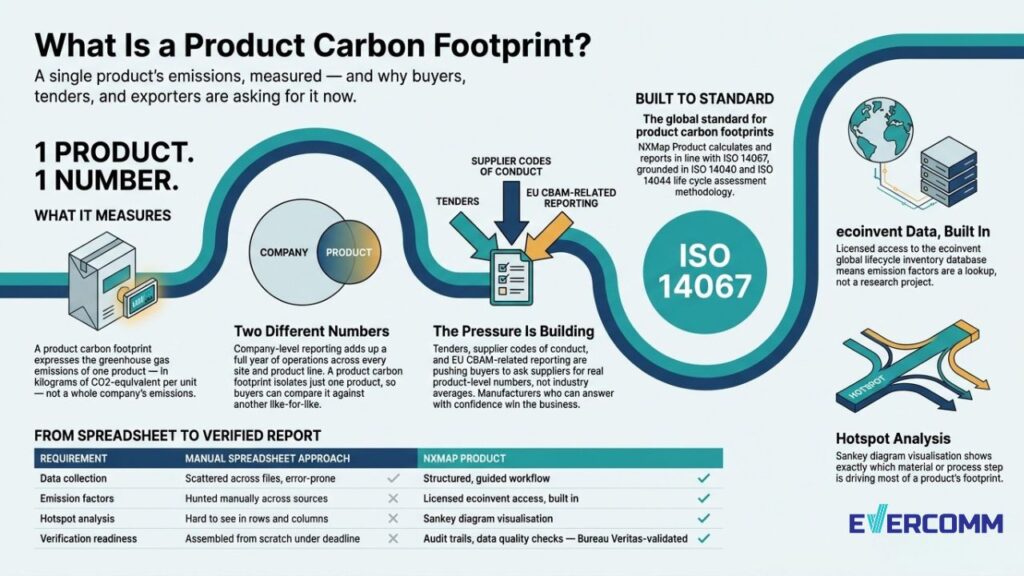
A product carbon footprint measures the greenhouse gas emissions associated with a single product, across some or all of its life — from raw material extraction, through manufacturing, to distribution and end of life. It’s usually expressed as a single figure: kilograms of CO2-equivalent per unit.
This is a different exercise from company-level carbon reporting, worth being clear about. Company-level reporting — the kind most organisations already know — adds up emissions across an entire operation for a full year: every site, process, and product line, combined into one organisational number. A product carbon footprint zooms in. It isolates one product and traces only the emissions belonging to it, so a buyer can compare that product against another on a like-for-like basis.
Both are legitimate and useful, but they answer different questions. Company-level reporting tells a bank or a board how the business as a whole is performing. A product carbon footprint tells a customer or a buyer what they’re actually purchasing. As product-level questions become more common in commercial relationships, a defensible answer — rather than an estimate scribbled together under deadline — matters more each year.
Why this matters right now
Product carbon footprint requests aren’t showing up because of a single new law. Demand for product-level emissions data is climbing from several directions at once, and manufacturers who export or supply larger buyers are feeling it first.
Large customers and retailers are asking suppliers to disclose product-level emissions as part of routine procurement — sometimes as a formal scoring criterion in a tender, sometimes as a standing requirement in a supplier code of conduct. Multinational buyers are under their own pressure to report supply chain emissions, and the easiest way to do that accurately is to ask each supplier for real figures, not industry averages.
Exporters into the European Union are watching a related pressure build: the EU’s Carbon Border Adjustment Mechanism is placing reporting obligations on imports of certain carbon-intensive goods, reshaping how buyers in those supply chains think about embedded emissions. This isn’t a blanket legal mandate covering every product — its scope is specific — but it has raised the general bar, and buyers across many sectors are now more likely to ask about a product carbon footprint even outside CBAM’s direct reach.
And then there’s supplier engagement. Companies managing large supply chains increasingly use product-level emissions data to select and improve their supplier base, rewarding lower-carbon inputs. A manufacturer that can produce a credible product carbon footprint on request is simply easier to do business with.
What actually doing this looks like
Calculating a product carbon footprint properly is a structured, methodical process — not a guess dressed up in decimal points.
It starts with data collection: every material, process step, and energy input that goes into making the product, gathered in a structured way rather than scattered across spreadsheets. This is where most manual attempts get stuck — not because the concept is hard, but because tracking dozens of inputs by hand is slow and error-prone.
Once the activity data is in hand, each input needs an emission factor — a figure representing how much CO2-equivalent is associated with a unit of that material or process. Rather than hunting across disconnected sources, teams doing this properly draw on a recognised global lifecycle inventory database, most notably ecoinvent, which holds standardised emission factors across thousands of materials and processes.
With the data and factors in place, the calculation follows a defined methodology, tracing emissions stage by stage through the product’s life. The output isn’t just a single number — it’s a breakdown of where the emissions come from. This is where hotspot analysis earns its keep: a visual breakdown, often shown as a Sankey diagram, that traces emissions through each material and process, making it obvious which one or two things drive most of the footprint — often a single raw material or one energy-intensive step, hard to see in a spreadsheet but obvious once visualised.
The benefits — for the person doing the work, and for the business
For the people doing this work, the benefit is straightforward: clarity without the manual grind. A structured process replaces the anxiety of building a one-off spreadsheet from scratch each time a customer asks, and produces a number the team can explain, rather than one they hope nobody scrutinises too closely.
For the business, the benefits compound from there. A company that can produce a credible product carbon footprint on short notice responds to tender requests with confidence instead of delay — and delay in a tender can mean losing the opportunity entirely. Product-level emissions data also strengthens supplier negotiations, giving procurement a factual basis for choosing between materials or partners rather than marketing claims. For exporters, it supports positioning in markets where carbon-related trade pressure is rising. And it builds a more credible sustainability story, grounded in verifiable numbers rather than broad claims that don’t hold up under scrutiny — the gap that has kept many manufacturers, particularly across Southeast Asia, stuck at the spreadsheet stage far longer than they should be.